

Nurses help to ensure patient safety, which includes preventing falls and fall related injuries. The aging Veteran population, like the general population, is at risk for falls and fall related injuries whether at home, in hospitals or in long term care facilities. Nurses are leading practice innovations to systematically assess patients’ risk for falls and implement population based prevention interventions. To determine the effectiveness of programs, data can be analyzed using a variety of statistical measures to determine program impacts. Thus, data analysis of fall rates by type of fall and severity of fall related injury can help facilities examine the effectiveness of their interventions and program outcomes. Examples of actual fall prevention programs and their approaches to measurement are showcased in this article.
Key Words: Falls, fall rates, hip fractures, prevention, quality improvement
Patient falls are one of the top five sentinel events for hospitals, long term care, and home care agencies... |
Nurses help ensure patient safety, including prevention of falls and fall related injuries. Patient falls are one of the top five sentinel events for hospitals, long term care, and home care agencies because of loss of function and injury that results. The Joint Commission on Accreditation of Healthcare Organizations (JCAHO) defines a sentinel event as an unexpected occurrence involving death or serious injury (e.g., loss of limb or function), or the risk thereof (JCAHO, 2006, para.1).
Fall-related injuries are a serious health issue for the aged population (Centers for Disease Control and Prevention [CDC],2007). Nurses make a major contribution to patient safety by assessing fall risk and designing patient-specific fall prevention interventions that reduce risk and prevent falls and fall-related injury. Falls have been linked to nurse staffing patterns and thus, some falls are preventable (Potter, Barr, McSweeney, & Sledge 2003). Knowledge of fall prevention program deployment and evaluation using statistical analysis can help nurses design and test effectiveness of fall prevention programs. This article describes exemplars of development and evaluation of fall prevention programs.
Statistics Related to Falls in United States
Social and economic burden of falls and fall related consequences is great. |
"Among people 65 years and older, falls are the leading cause of injury deaths and the most common cause of nonfatal injuries and hospital admissions for trauma" (CDC,2007, para.1 ). For this population, more than half of all falls happen at home (CDC, 2006b). Fractures are the major category of injuries produced by falls with 87% of all fractures in older adults resulting from falls (Magaziner et al., 2000). Fall rates for residents of long-term care facilities are almost three times higher than for residents living in homes, and more frequently result in fracture, laceration, or the need for acute hospital care (Eakman et al., 2002). Recent estimates of fall incidence during an acute care admission range from an average rate of first falls of 2.2 per 1000 patient days (Magaziner et al.,) to an average fall rate on medical/surgical units of 3.6 falls per 1000 patient days (Donaldson, Brown, Aydin, Bolton & Rutledge, 2005). These estimates are probably under-representative of actual fall rates because not all falls are reported.
Social and economic burden of falls and fall related consequences is great. The total cost of fall injuries for adults aged 65 and older in 1994 was $27.3 billion; by 2020 it is estimated the cost will be $43.8 billion (CDC, 2006b). Reports from the CDC (2005) note that fall-related deaths are higher among men than among women and that the incidence of fall-related injuries in the aging U.S. population will continue to increase. For example, they have estimated that the number of hip fractures, a serious fall related injury, will rise from 350,000 admissions per year to over 500,000 by 2040 (CDC, 2006a).
Nursing Leadership in Fall Prevention
Patient injury rate...[is] a nurse sensitive indicator, a measure of quality that links patient outcomes with availability and quality of professional nursing services. |
In 1995, the American Nurses Association (ANA) Board of Directors commissioned the development of nursing quality indicators that link nursing care and patient outcomes. Patient injury rate, noted to be most often caused by falls, was promoted as a nurse sensitive indicator, a measure of quality that links patient outcomes with availability and quality of professional nursing services (ANA, 1995). The ANA asserted nurses' responsibility to assess patients' risk for falls and injury, design and implement risk reduction care plans, and evaluate effectiveness of clinical fall prevention programs. ANA also recommended consistency of data reporting, measurement and analysis. Because of these efforts, by the next decade, valid and reliable fall risk assessment tools and standardized post fall analysis and rates are available for use in nursing practice. Adoption of the ANA recommendations encourages organizations to analyze effectiveness of fall prevention programs that are unit-specific and population-based. The recommendations suggest that clinical, administrative and risk management staff conduct in depth data analysis and provide unit-specific feedback to staff regarding fall rates and fall related injury rates. Following these practices has resulted in the emergence of best practices for patient safety related to reduced falls and fall-related injuries, as showcased in this article’s exemplars. These exemplars describe actual fall programs across settings, along with strategies to showcase data at the unit level and compare fall program outcomes over time.
Analyzing Fall Related Data
Health care organizations rely on incident reports for counting the frequency of falls and collecting fall-related data. When a fall occurs in a health care organization, an incident report is completed to record the occurrence and circumstances surrounding a fall. The definition of a fall in the Veterans Health Administration (VHA) is "loss of upright position that results in landing on the floor, ground or an object or furniture or a sudden, uncontrolled, unintentional, non-purposeful, downward displacement of the body to the floor/ground or hitting another object like a chair or stair" (Department of Veterans Affairs, 1996, p. 4)
Many facilities (VA and non-VA) use an incident report form for falls, specifically designed to collect data based on evidence about factors contributing to fall occurrences (Elkins et al., 2004). For example, these data might include time of day, location, activity, orthostasis, and incontinence. From the analysis of the data, one can determine the type of fall, such as accidental, anticipated physiological, and unanticipated physiological fall (Morse, 1997) and severity of injury, i.e., minor, moderate or major/severe (Buffum, 2004; Donaldson et al., 2005). Analysis of data of this depth and scope enables clinicians, administrators and risk managers to profile the level of fall risk of their patients along with actual factors contributing to the fall, as well as to identify overall patterns and trends surrounding fall occurrence
Standardizing Rates
When analyzing effectiveness of fall prevention programs, rates of both fall incidence and severity of injury should be included. |
When analyzing effectiveness of fall prevention programs, rates of both fall incidence and severity of injury should be included. Each rate is needed to monitor the effectiveness of fall prevention interventions for a specific population in a specific clinical setting. For example, in acute care and long term care settings, restraint use has been reduced to improve patient freedom and reduce restraint related injury and death (Capezuti, 2004; Capezuti & Harrington, 2004). In response to restraint reduction, increased falls were anticipated. Systematic data analysis helps nurses to test this assumption.
Fall rates. Fall rates can be analyzed at either the individual unit or overall facility level. We suggest using the following formula (ANA, 1995; Morse, 1997).
Number of Patient Falls
____________________ X 1,000
Number of Patient Bed Days
This fall rate accounts for changes in patient census so that fall rates can be adjusted for census and then compared across clinical units.
Injury analysis by severity levels enables clinical and administrative staff to profile both vulnerability of their patients and effectiveness of patient safety programs. |
Repeat fall rates. An elevated fall rate may be due to one patient who has fallen several times. Repeat fallers may account for a large percentage of falls within a single clinical unit of an organization. Thus, we recommend a sub-analysis of the fall data, to determine what percent of the falls are second, third, fourth or more falls. These repeat fall frequencies are needed in order to determine the effectiveness of interventions to prevent repeat falls. For example, one clinical unit may report that 90% of their falls were single falls; yet, a second clinical unit with the same patient population as unit one reports 40% single falls and 60% repeat falls (40% of falls were second falls and 20% were third falls). This sub-analysis offers clinicians, administrators and risk managers important information for strategic interdisciplinary planning and corrective action.
Injury rates. The injury rate reports how many injuries occurred per 100 falls. It is important to separate the injuries based on severity. One approach is to use the following formula (Department of Veterans Affairs, 2004).
Number of Injuries
_______________ X 100
Number of Falls
The multiplier is changed to 100 to produce a meaningful rate for such a rare outcome. We suggest measuring both major and minor injuries rates. As an example of injury rates, a facility has had 80 falls in the last month. Of the 80 falls, 5 resulted in a minor injury such as an abrasion, hematoma not requiring medical attention, 3 falls resulted in a major injury, such as a hip fracture, and the remainder resulted in no injury .
Minor Injury Rate = (5/80) x 100 = 6.25 per 100 falls (6.25%)
Major Injury Rate = (3/80) x 100 = 3.75 per 100 falls (3.75%)
To interpret these rates, one would communicate that 6.25% of the falls last month resulted in minor injuries and 3.75% resulted in major injuries (Department of Veterans Affairs, 2004).
Increases in the length of time between major injuries are another indicator of the effectiveness of fall reduction programs. |
Injury analysis by severity levels enables clinical and administrative staff to profile both vulnerability of their patients and effectiveness of patient safety programs. For example, if 80% of patients who sustain lateral falls fracture their hips, one would suspect a large prevalence of osteoporosis. If one unit exceeds other units on their monthly fall rates and has higher injury rates, one would target that unit for evaluation and intervention.
In addition to tracking injury and injury severity rates, another performance indicator is the number of days between major injuries. Increases in the length of time between major injuries are another indicator of the effectiveness of fall reduction programs.
Trending Rates
Clinicians, administrators, and risk managers collaborate to set realistic target goals for reducing rates of falls and fall-related injuries through implementation of patient safety interventions. Once systems are developed for fall rate tracking and internal comparison, organizations can both identify trends and compare rates to those from national databases. Fall rates should compare with similar populations. For example, fall rates for acute care units should be compared with those for other acute care units, those for an organization's dementia populations with similar populations, and so on.
The National Database of Nursing Quality Indicators® (NDNQI) enables comparison of fall rates and other nurse sensitive indicators for enrolled acute care organizations (American Nurses Association, 2004-2006). The Uniform Data System for Medical RehabilitationSM (UDSMR) for acute rehabilitation has a quality improvement program to analyze and report inpatients by demographic profile (age, gender, diagnosis) who fall once or more than once during their length of stay. The Minimum Data Set Resident Assessment Instrument (MDS RAI) (Centers for Medicare and Medicaid, 2006 is required data that certified Medicare or Medicaid facilities must submit to the Centers for Medicare and Medicaid Services (CMS) for certification as a Medicare or Medicaid nursing provider, and for reimbursement. These data must be recorded, encoded and transmitted to CMS, or the must be completed for all residents The MDS data are collected within 14 days of admission and quarterly, recording if a resident fell during the assessment interval.
Data Presentation Tools
Visual presentation of falls data is an effective method for summarizing and presenting outcomes and trends over time. Run charts and control charts are two tools that provide this visual display and
Visual presentation of falls data is an effective method for summarizing and presenting outcomes and trends over time. |
allow for evaluation of a program’s effectiveness as well as identification of influential factors on program outcomes.
Run charts. Run charts visually display plotted data over time (Carey & Lloyd, 2001). Their usefulness in analyzing falls data is enhanced by the ability to annotate the chart with narrative comments on the graph about when and what actions were implemented to reduce patient falls. This chart helps to put the data display into context for the viewer, such as the staff nurses on the unit, (Wheeler, 2000).
One site used a run chart to track and display their restraint reduction (Figure 1). Run charts are helpful tools for giving data-based feedback to staff. They can also be used to assess process measures, such as percent of staff trained in fall prevention.
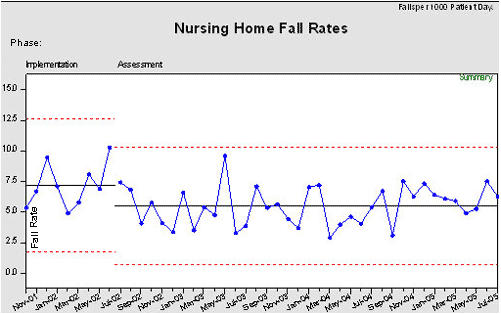
Control charts. Control charts are a specific kind of run chart intended to assess the amount of variation within a specified measurement range referred to as upper and lower limits of performance and quality control (Wheeler, 2000). A control chart used for fall rates could include the fall rate (number of falls per 1000 bed days of care) plotted by month for the unit.
The control chart provides visual cues that help the viewer understand how the data relate to the process and outcomes of patient care. |
The control chart provides visual cues that help the viewer (i.e., nursing staff) understand how the data relate to the process and outcomes of patient care. The upper control limit (the top dotted line) and lower control limit (the lower dotted line) represent thresholds that bracket approximately 99% of the normal variation reflected in the data (Benneyan, Lloyd & Plsek, 2003; Boggs, Hayati, Washburne, & Wheeler, 1999; Carey & Lloyd, 2001; Wheeler, 2000). The center line (dark solid line) is the mean or average of all the data points previously collected and averaged (Carey & Lloyd). The control limits are determined through statistical methods for calculation standard deviations (3 standard deviations) around the mean. The standard deviations provide a measure of the average deviation from the mean score, accepting that a certain degree of error would be made if only the mean score was used. Points that fall outside the control limits are likely to be reflective of a significant change in the fall rates. For example, if fall rates of a specific unit were both above the upper limits, that unit would have a significant change has occurred, warranting examination of contributing circumstances (e.g., environmental hazards, lack of individualized fall prevention care plans, decreased staffing, and higher percent of incontinent patients). If, on the other hand, the falls rates were below the lower limits of the control chart, that unit causes of which should also be examined (e.g., extraordinary interdisciplinary fall prevention efforts or high restraint use).
For example, the control chart in Figure 2 displays the monthly fall rate on one unit in the facility where a pilot fall prevention program was established. An interdisciplinary fall quality improvement team participated in individualized patient fall prevention care planning and fall-rate reporting. Discussions were held monthly and results of continuous monitoring of number of days without a fall were posted on the unit During the fall prevention program implementation phase, the mean fall rate was 9.75 falls per 1000 bed days of care (BDOC), as portrayed by the center line in the chart. Throughout this phase, the staff introduced many fall prevention initiatives. Nine months after implementation of most of the planned initiative, the impact of these initiatives was assessed by plotting fall rates ("Assessment" Phase, Figure 2).
During this time the average fall rate dropped to 4.49 falls per 1000 -BDOC on the pilot unit, creating a new center line for the average fall rate. Next, new upper and lower control limits were calculated that reduced the amount of variation around the mean. By viewing the control chart, staff members of the pilot unit were able to visualize the affect of the initiatives that were implemented.
These charts provide nursing staff with visual displays of data indicating the results of nursing and interdisciplinary care. |
During the assessment phase, monthly fall rate data are entered into the control chart, performance continues to be monitored, and the chart is annotated to determine when the initiatives are introduced relative to trends (within and outside of the control limits). All parties, nursing staff, administration and risk management, monitor for the desired effects for improved patient safety.
These charts provide nursing staff with visual displays of data indicating the results of nursing and interdisciplinary care. For example, using the graph may reveal that a high fall rate in a particular month was related a higher census of patients with stroke on the unit. In contrast, the graph may reveal a lower fall rate over months after routine toileting rounds were implemented by the nursing staff; noting the start of the toileting program on the control chart can help analyze changes in fall rates over time.
Exemplar: Development of a Falls Program and Use of Control Charts
Following is an exemplar of development and implementation of a fall prevention program, using control charts to evaluate its effectiveness and share the outcomes with staff. The program was developed for three long term care units representing 160 beds in a rural 400-bed Veterans Administration Medical Center that provides acute medicine, psychiatry, intermediate medicine, and long term care. The nursing staff working in an interdisciplinary team lowered the average fall rate by 54% on the pilot unit (Figure 2) and 27% on all three units combined during the implementation phase (Figure 3).
Prior to the fall prevention program, a comprehensive, coordinated approach to fall prevention did not exist with each unit working in isolation on its fall prevention program. Nursing staff assessed patients' risk for falling with a "home grown" risk scale, the incident reporting system was cumbersome and lengthy, and periodic audits suggested that falls were under reported.
To address these problems, a Process Action Team (PAT) was formed and conducted a comprehensive data analysis to assess the current nature and scope of falls occurring on the long term care units. The team members analyzed medical record data related to the location, severity, time of day, and frequency of falls, and identified residents with multiple falls. Based on their analysis, the team concluded that fall "prevention" efforts had been reactive, i.e., initiated after a fall occurred, and recommended the development of a coordinated proactive fall prevention program. Specific components of the program the PAT recommended were:
- Establishing an interdisciplinary falls workgroup
- Developing an interdisciplinary fall prevention program policy
- Implementing a reliable and valid fall risk screening tool
- Establishing a near miss and hazard reporting system
- Establishing electronic documentation tools that would provide useful data for continuing process improvements
- Developing a formulary of medications associated with falls which can also be used as a staff education tool
- Establishing fall safety-specific environmental rounds
- Increasing staff education and awareness of fall risk, screening, and intervention.
The falls workgroup was immediately established under the direction of the PAT, and developed a strategic plan to implement and evaluate the impact of the above actions. For implementation and evaluation, the workgroup used the Plan–Do-Study-Act (PDSA) cycle of planned change (Langley, Nolan, Nolan, Norman & Provost, 1996). This four-part, action-oriented cycle for improvement enables a group to examine barriers to and facilitators of an intervention and assess its outcome before moving to the next step of an improvement plan. Before implementing any new intervention on a large scale, a small scale test of changes enables a workgroup to test one action at a time, and modify the intervention to fit the environment at the unit level.
The key interventions accomplished during the implementation phase were: standardization of the definition of a fall; selection of a valid and reliable fall risk screening tool; establishment of a hospital-wide fall prevention program policy; development of electronic medical record fall risk assessment and care plan documentation tools; redesign of the fall incident reporting system; stratification of patient fall risk identification levels and system of communication; and development of patient education fall prevention materials. Additionally, interdisciplinary environmental rounds were implemented for patient safety and fall prevention. The environmental rounds involved staff members from throughout the facility conducting unit surveys with a goal to reduce environmental hazards and provide lessons learned as a part of staff education.
Progress made during each phase of deployment and system change was celebrated through a recognition program. Thus, the workgroup's successes were an integral part of the medical center’s staff recognition program. Another key intervention, medication reviews, were initiated to heighten the awareness of side effects that may increase fall risk and are now done routinely for patients with frequent falls.
Lastly, a key intervention was implemented to address communication gaps in the information collected about a fall and reporting the fall occurrence among disciplines. Since these fall related information are integral part of the fall prevention program, a unit-based fall data and communication tracking sheet (Figure 4) was developed to monitor fall specific data, and is available to all providers directly responsible for the care of the residents. This new process is considered an administrative intervention to fill gaps in the fall prevention program, and thus can be tracked for impact on the fall prevention program.
[A communication tracking sheet]...complements a control chart, because this sheet provides information about the single fall, whereas a control chart uses averaged data about monthly fall rates. |
As a result of this sheet, anyone on the unit can visually see a patient who fell, and where the staff are in the communication process about the fall occurrence and revising the plan of care to prevent a repeat fall. This sheet visually displays fall occurrences for nurses and physicians on a unit, and any staff member can easily view the unit’s most recent falls. Also staff can easily view a resident who experienced multiple falls and track when all elements of the post fall care plan were completed. This type of information complements a control chart, because this sheet provides information about the single fall, whereas a control chart uses averaged data about monthly fall rates.
When using control charts to evaluate the effectiveness of a particular program, the team may want to develop two separate charts for each phase of a process, each with its own mean and upper and lower limits plotted. The first control chart (Figure 2) depicts the "implementation" phase of the previous mentioned key interventions and initiatives where the PDSA cycles were developed and the "ongoing assessment" phase in which analysis and evaluation occurs on the pilot unit. Comparing the assessment phase to the implementation phase, the overall rate of falls decreased 54% (from 9.75 to 4.49 falls per month). The chart also demonstrates acceptable fall rates being sustained over time (46 months), (Figure 5). During the Assessment Phase, the falls workgroup reviewed the control charts at biweekly meetings, providing data reports to staff and local leadership monthly. In addition to monitoring fall rates, the falls workgroup also tracked minor and major fall-related injuries as part of their patient safety and quality improvement program.
The team achieved its patient safety goals by reducing the residents' fall rate and severity of fall-related injury. This accomplishment is even more significant because it was achieved while concurrently eliminating use of restraints as a fall prevention measure (Figure 1). The team has since used falls data to internally compare ongoing progress in patient safety.
Exemplar: Fall-related Injury Tracking and Prevention
...facilities should track types of injuries and severity...all falls are not equal. A fall that results in minor injury is not the same as a fall that results in death. |
The second exemplar relates to fall-related injury tracking and prevention. This exemplar is included to demonstrate how units can expand data analysis of fall prevention programs beyond fall rates. As stated in the introduction, fall-related injuries have serious consequences that can include loss of function or death. The first two steps for an injury tracking system are to define types of injuries and stratify severity of injury. This is important to standardized coding of injury type and severity for surveillance and analysis because all falls are not equal. A fall that results in minor injury is not the same as a fall that results in death. Therefore, facilities should track types of injuries (such as lacerations, fractures, and bleeds) and severity of injuries (none, minor, major, or death). The Veterans Health Administration (VHA) has a national policy for definition and classification of severity of injury (i.e., 0-no injury, 1-minor injury, 2-major injury, 3-death). The system includes descriptors for each class. For example, a minor injury would be an abrasion, bruise, or small surface laceration not requiring medical action, whereas a major injury would be one that requires medical action, such as a hip fracture, head trauma, or arm fracture (VHA, 2001). One classification system for injury severity has not been adopted nationally by non-VHA facilities; as a result, one should include the classification system used in analysis when reporting fall related injury data. The following exemplar describes one VHA facility’s approach to reporting fall-related injury data, and the success they have made in reducing severe injuries.
The VHA setting is a rural 118-bed long term care Veterans Home. In 2001, a nurse manager, Director of Nursing Services, and quality manager from the organization participated in the national VHA multi-facility quality improvement project, designed to reduce falls and fall-related injuries among inpatients. Thirty-seven teams from VHA hospitals, Veterans nursing homes and one private facility completed an 8-month facilitated quality improvement project. These teams tracked fall and injury rates and reported on interventions implemented. Team characteristics were assessed by a survey at each learning session and each team was rated on their overall performance at the end of the project. More detailed information about this national quality improvement project has been published (Mills, Waldron, Quigley, Stalhandske & Weeks, 2003).
Communication is one of the key elements of successful patient safety programs. |
After this site's participation, the staff's interventions ultimately led to decreased falls and related injuries. To make this assertion, the staff learned the importance of developing a data display that accurately and simply shares information about fall rates along with injury by type and severity
When this site first enrolled in the National VHA Falls Quality Improvement Project, quality managers displayed fall rates and injury rates using line graphs, reporting statistics for individual units and for the entire veterans' home. The injury rate was calculated by aggregating all injuries, without differentiation according to severity. Therefore, the overall injury rate was high because all injuries were grouped together. This method of reporting and analyzing aggregated data did not allow for evaluation of trends according to injury severity. Through further sub-analysis of injuries by severity, staff could better track efforts toward meeting unit and organizational goals in patient safety. Thus, a new method of classification and data analysis was needed.
Communication is one of the key elements of successful patient safety programs. According to the Joint Commission International Center for Patient Safety (2006), communication issues were the leading root cause of errors reported between 1995-2004, as well as the sentinel events reported in 2005 (Angood, 2006). At this medical center, results of a quarterly root cause analysis examining the root causes about why patients fell, revealed that effective communication (handoff, incident reporting, post fall assessment and data analysis) was a contributing problem. Therefore their interdisciplinary falls quality improvement team agreed that strategies were needed to improve effective and detailed communication among providers in efforts to improving their fall prevention program (Neily et al., 2003). This team decided on three strategic actions: (1) designing a tracking system that monitors patients who fall, communication, changes in plans of care and the fall reporting process; 2) providing detailed and timely reports about fall rates and injury by level of severity; and 3) implementing a consistent reporting and signage program to routinely communicate about patients at risk for falls.
Thus, communication systems were put in place for signage to identify patients at risk for falls, shift reports to communicate patient risk status, and revised charts with more detailed analysis of falls and fall-injury rates. Realizing that their long term care veteran population was all high risk for falls, they decided to increase focus on injury prevention, protecting veterans from falls and injury. To support this focus, all staff in the long term care facility was educated about fall risks, risks for injury, communication systems and the data reporting methods. Also, quality managers decided to analyze fall injury data by the three categories used in the veterans nursing home in this state: (1) Minor; (2) Moderate; and (3) Serious. Category 1 and 2 were calculated together as minor/moderate injury rate. Category 3 was a separate rate. Serious injury was defined as: any injury that changes a resident’s level of care and/or level of self care and or mobility.
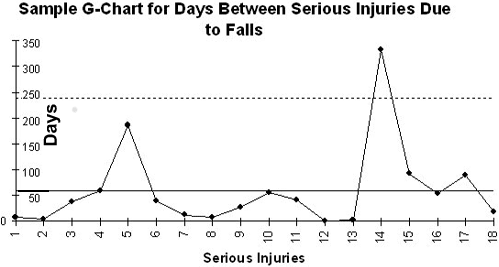
[A visual] approach is much more meaningful to staff than hearing or seeing a rate...[telling] the story through collaboration, communication, and celebration. |
The falls workgroup decided to use the G-chart method (Benneyan, 2001a, 2001b; Benneyan et al., 2003) to track the number of days between serious injuries due to falls because this is a measure of survival (Figure 6). The horizontal axis marks each serious injury over a three year period (18 injuries, as indicated on the X axis); the vertical axis displays number of days (0-350 days). As shown in the chart, serious injury #1 occurred about five days after the program started, and serious injury #2 was about three days following #1. The largest interval was between serious injuries #13 and #14, a difference of about 330 days.
The G-Chart provides a visual display that is easily understood by all staff members. Higher peaks reflect longer injury-free intervals and thus reflect success. A chart with a continuing upward line depicts ongoing increases in injury-free days, a desired outcome.
Committed to communication, the quality manager reported the G-Chart data are shared at weekly team meetings. Each week the graph elevated with another seven days without serious injury from a fall. Administration and quality management wanted to recognize staff for their efforts and successes. The entire staff easily related to the G-Chart visually and verbally. This approach is much more meaningful to staff than hearing or seeing a rate. The G-Chart told the story through collaboration, communication, and celebration.
Conclusion
Protecting patients from falls and fall-related injuries requires shared responsibility...[and] integrating charts and graphs...into program evaluation at the point of care. |
Protecting patients from falls and fall-related injuries requires shared responsibility among health care providers, administrators, and risk managers. Yet, data analysis using only general fall rates lacks specificity needed to profile effectiveness of fall risk reduction programs and injury prevention methods. The exemplars of data management, analysis, and reporting for systematic analysis of patient, unit and organizational factors illustrated vital components of program evaluation needed for understanding the effectiveness of patient safety programs surrounding falls. These exemplars have results that are meaningful to patients, clinicians, administrators and policy makers. Falls can be prevented and severity of fall related injuries can be minimized. As showcased in the prior exemplars, quality managers, nurse managers, and staff are integrating charts and graphs, familiar to researchers, into program evaluation at the point of care. The exemplars demonstrate effective means for tracking additional outcomes in fall prevention programs.
Acknowledgements: Special thanks to Gregory Ogrinc, MD, General Internist, Veterans Affairs Medical Center, White River Junction, VT., for his review of the control chart description and Donald Leben, Health Systems Specialist, Bath VAMC, Bath, NY, for his contributions to selected control charts. This material is the result of work supported with resources and the use of facilities at the VISN 8 Patient Safety Center, Tampa, Fl., and the Field Office of the Veterans Affairs National Center for Patient Safety and the Veterans Affairs Medical Center in White River Junction, Vermont. The views expressed in the article do not necessarily represent the views of the Department of Veterans Affairs (DVA) or of the United States (US) Government.
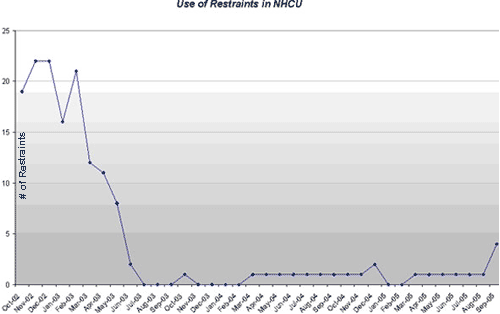
Figure 2. Control Chart, Pilot Unit.
Pilot Unit highlights implementation and ongoing assessment phases
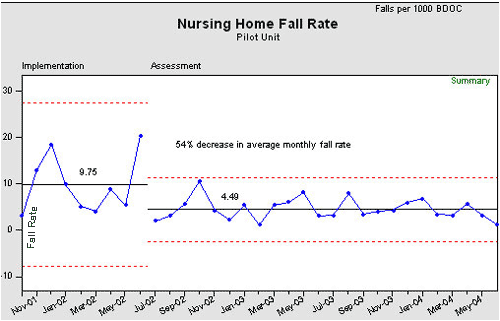
Figure 3. Control Chart, Nursing Home Care Unit.
The Nursing Home Care Unit, a 160 bed nursing home, highlights implementation and ongoing assessment phases.
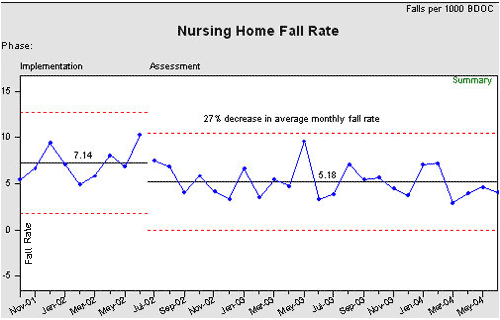
Figure 4. Unit-Based Fall Data and Communication Tracking Sheet
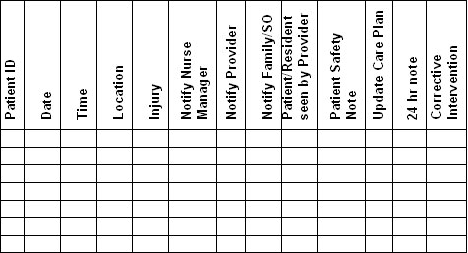
Figure 5. Control Chart. Longitudinal.
Control Chart. 160 bed nursing home sustained fall prevention program over 46 months.
Figures 1-5 reflect non-identifiable aggregate data only and are used courtesy of the VAMC at Bath, New York.
1 Splaine, M. MD, Co-Director, VA National Quality Scholars Fellowship Program developed original template for this g-chart. The site made slight modifications to the template. Reprinted with permission.
Authors
Pat Quigley, PhD, MPH, ARNP, CRRN, FAAN
Email: Patricia.Quigley@va.gov
Patricia Quigley, PhD, MPH, ARNP, CRRN, FAAN, is currently Deputy Director of the VISN 8 Patient Safety Center of Inquiry at the Tampa VA, and assists with oversight for the Clinical Falls Team. She has an adjunct faculty appointment at the University of South Florida, College of Nursing. Dr. Quigley is nationally known for her expertise in rehabilitation, functional outcomes, and fall prevention. She serves as expert consultant to VA and non-VA healthcare systems regarding fall prevention programs.
Julia Neily, RN, MS, MPH
Email: Julia.Neily@med.va.gov
Julia Neily, RN, MS, MPH works for the Veterans Health Administration (VHA) National Center for Patient Safety, Field Office in White River Junction, Vermont. She has worked for the VHA for over 21 years and she has a special interest in fall prevention.
Mary Watson, MSN, ARNP, BC
Email: Mary.Watson2@med.va.gov
Mary E Watson, MSN, APRN.BC has been employed at the Central Arkansas Veterans Healthcare System for 19 years. She has been functioning in the role of Patient Safety Practitioner since 2000 managing the Fall Prevention Program for a 2 division facility with a total of 550 beds.
Marilyn Wright, BSN, RN.C
Email: cmwright@centurytel.net
Marilyn Z. Wright BSN, RNC (retired) has over 20 years experience in long term care at the Missouri Veterans Home in Mt. Vernon, MO. She served as Staff Development Coordinator, Infection Control Coordinator and Quality Management Coordinator. She co-designed, implemented and directed a successful falls management program and tracking system through participation in the VA Fall Collaborative on reducing falls and injuries related to falls.
Karen Strobel, RN, MSN
Email: Karen.Strobel@med.va.gov
Karen Strobel has served the veteran's of Western New York at Bath for 19 years. She has functioned as an ICU Nurse, Risk Manager, and presently as the Performance Manager. She lead the facility falls workgroup that successfully participated in the VA's collaborative to reduce falls and injuries due to falls.
References
American Nurses Association. (1995). Nursing care report card for acute care. Washington, DC: American Nurses Publishing. Retrieved December 18, 2006, from www.nursingworld.org
American Nurses Association. (2004-2006). Nursing database for nursing quality indicators. National Center for Nursing Quality. Accessed 12/28/06 available at http://www.nursingquality.org
Angood, P. (2006). National patient safety goals. Joint Commission International Center for Patient Safety. Power Point Presentation at the 2006 National Patient Safety Foundation.
Benneyan J. C., Lloyd R. C., & Plsek, P. E. (2003). Statistical process control as a tool for research and healthcare improvement. Quality and Safety in Health Care, 12(6), 458-464.
Benneyan, J. C. (2001a). Number-between g type statistical quality control charts for monitoring adverse events. Health Care Management Science, 4(4), 305-318.
Benneyan, J. C. (2001b). Performance of number-between g-type statistical control charts for monitoring adverse events. Health Care Management Science, 4(4), 319-336.
Boggs, P. B., Hayati, F., Washburne,W. F., & Wheeler, D. A. (1999). Using statistical process control charts for the continual improvement of asthma care. The Joint Commission Journal on Quality Improvement, 25(4), 163-181.
Buffum, M. (2004). VANOD (Veterans Administration Nurse Outcomes Database) Project on Falls. Presented June 24, 2004.
Capezuti, E. (2004). Building the science of fall-prevention research. Editorial. JAGS, 52(3), 461-462.
Capezuti, E., & Harrington, C. (2004). FOCUS ON: Care of older adults in hospitals. American Journal of Nursing, 104(5), 73-74.
Carey, R. G., & Lloyd, R. C. (2001). Measuring quality improvement in healthcare: A guide to statistical process control applications. Milwaukee, WI: Quality Press.
Centers for Disease Control and Prevention. (2005). Falls among older adults: An overview. National Center for Injury Prevention and Control. Retrieved January 4, 2007, from www.cdc.gov/ncipc/factsheets/adultfalls.htm.
Center for Disease Control and Prevention. (2006a). Hip fractures among older adults. Retrieved 02/13/07 from: www.cdc.gov/ncipc/factsheets/adulthipfx.htm
Center for Disease Control and Prevention. (2006b). How costly are fall-related injuries among older adults? Retrieved February 13, 2007, from www.cdc.gov/ncipc/factsheets/fallcost.htm
Center for Disease Control and Prevention. (2007). Preventing falls among older adults. Retrieved February 16, 2007 from: www.cdc.gov/ncipc/duip/preventadultfalls.htm
Centers for Medicare and Medicaid. (2006). Minimum data set (MDS 2.0). Accessed 12/28/06. Available at www.cms.hhs.gov/MinimumDataSets20/025
Department of Veterans Affairs, Veterans Health Administration (VHA) National Center for Patient Safety. (2004). Falls toolkit. Retrieved December 18, 2006, from http://vaww.ncps.med.va.gov/FallsToolkit.
Department of Veterans Affairs. (1996). Clinical practice guidelines: The prevention and management of falls. Washington, DC: Author.
Donaldson, N., Brown, D. S., Aydin, C. E., Bolton, M. I., & Rutledge, D. N. (2005). Leveraging nurse-related dashboard benchmarks to expedite performance improvement and document excellence. Journal of Nursing Administration, 35(4), 163-172.
Eakman, A. M., Hanevs, M. D., Ager, S. J. Buchanan, R. L., Fee, N. J., Gollick, S. G., et al. (2002). Fall prevention in long -term care: An in-house interdisciplinary team approach. Topics in Geriatric Rehabilitation, 17(3), 29-40.
Elkins, J., Williams, L., Spehar, A., Marano-Perez, J., Gulley, T., & Quigley, P. (2004). Successful redesign: Fall incident report – A safety initiative. Federal Practitioner, 21(3), 29-44.
Joint Commission on Accreditation of Healthcare Organizations (JCAHO). (2006). Top 5 sentinel events by setting of care, January 2001 to July 2005. Retrieved December 18, 2006, from www.jointcommission.org/SentinelEvents/Statistics/
Langley, G. J., Nolan, K. M., Nolan, T. W., Norman, C. L., & Provost, L. P. (1996). The improvement guide. A practical approach to enhancing organizational performance. San Francisco: Josey-Bass.
Magaziner, J. Hawkes,W. Hebel, R., Zimmerman, S., Fox, K., Dolan, M., Felsenthal, G., &
Kenzora, J. (2000). Recovery from hip fracture in eight areas of function. Journal of Gerontology Medical Sciences, 55A(9), 498-507.
Mills, P. D., Waldron, J., Quigley, P. A., Stalhandske, E., & Weeks, W. B. (2003). Reducing falls and fall-related injuries in the VA system. Journal of Healthcare Safety, 1, 25-33.
Morse, J. (1997). Preventing patient falls. Thousand Oaks, CA: Sage.
Neily, J., Ogrinc, G., Mills, P., Williams, R., Stalhandske, E., Bagian, J., et al. (2003). Using aggregate root cause analysis to improve patient safety. The Joint Commission Journal on Quality and Safety, 29(8), 434-439, 381.
Potter, P., Barr, N., McSweeney, M., & Sledge, J. (2003). Identifying nurse staffing and patient outcome relationships: A guide for change in care delivery. Nursing Economics. 21(4):158-166.
Uniform Data System for Medical Rehabilitation. (n.d). Buffalo,NY. Accessed 12/28/06. Available at www.udsmr.org
VHA. (2001). Patient personal freedoms and security. Fall prevention and management flipbook. Washington, DC: Department of Veterans Affairs, VHA National Center for Patient Safety.
Wheeler, D. J. (2000). Understanding variation. The key to managing chaos. Knoxville, TN: SPC Press.